Improving Android app performance with Benchmarking

Hello, all the Android developers here. Let’s start with some question. How many of you have your apps published on Play Store? Not on the play store? Ok, how many of you have built some application that is being used by more than 100 users? Have you taken the feedback? Is everyone satisfied with the app performance? By app performance, I mean to ask the smoothness of the app i.e. the working of the application without having any lagggggggg. Oh, the lagging of an application depends on the device that the user is using. Is it so? Yeah, it is so, but you can improve the performance of your app by improving your code(irrespective of the device configuration). You heard it right :)
In this blog, we will learn how you can improve the Android app performance with Benchmarking. What is this Benchmarking? Hold on! we will learn step by step. Here is the timeline of today’s blog.
- Code measurement
- What is Benchmarking?
- Jetpack Benchmark library
- Integration with Android Studio
- Benchmark configuration
- Factors affecting Benchmarking
- Don’t Benchmark everything
- Closing notes
So, have your coffee with you because this is going to be a long blog and then enjoy the coffee with some Benchmark flavor in it. Let’s get started.
Code Measurement
Apart from the hardware of devices, the performance of an Android application is also dependent on the algorithm that you have used in your application. Choosing the right algorithm and data structures should always be your priority. These are micro-optimization that can be done in your app with the help of these changes. So, to make sure your application performs well across a wide variety of devices, please ensure your code is efficient at all levels and this will optimize your performance.
You shouldn’t write the code that your application doesn’t need. Also, please don’t allocate the memory if you can avoid it. Some of the tips for writing efficient code can be:
- Unnecessary Object: Avoid creating unnecessary objects because when you create more objects in your app then more memory is taken by the app.
- Prefer static over virtual: Using static method over virtual can be 15–20% faster. So, try to use that when you don’t need to access an object’s fields.
- Use for-each loop: Instead of using a normal for loop or other loops, prefer using the enhanced for loop i.e. the for-each loop for collections that implement the Iterable interface and for arrays.
- Avoid using floating-point: Try to avoid using floating-points because they are 2x slower than the integer on Android devices.
So, these are some of the tips that can be used to improve code performance. But how can I judge the difference between the time taken earlier with my old code and the time taken now with the improved code? So is there any way to measure the code performance? Is there any way to measure how much time it takes to run a chunk of code? Yes the answer is called Benchmarking. But before moving on to Benchmarking, let’s look at some naive solution to calculate the time taken by a chunk of code to run.
@Test
fun codeMeasurement() {
    val worker = TestListenableWorkerBuilder<MyWorker>(context).build() //jetpack workmanager library
    val start = java.lang.System.nanoTime() //for starting time of work
    worker.doWork() //do some work i.e. code to be measured
    val elapsed = (java.lang.System.nanoTime() - start) //time taken to complete the work
    Log.d("Code Measurement", "Time taken was $elapsed ns")
}
Here, in the above example, we are calculating the time taken to do the work by subtracting the end time with the start time. But the problem here is that, we will get different results every time we run the same code duw to various hardware and software problems. So, instead of taking one value, we can apply one loop and find the average of the same to get the elapsed time.
@Test
fun codeMeasurement() {
    val worker = TestListenableWorkerBuilder<MyWorker>(context).build() //jetpack workmanager library
    val COUNT = 5 //some iteration count
    val start = java.lang.System.nanoTime() //for starting time of work
    for (i in 0..COUNT) {
        worker.doWork() //do some work i.e. code to be measured
    }
    // include outliers
    val elapsed = (java.lang.System.nanoTime() - start) / COUNT //average time taken to complete the work
    Log.d("Code Measurement", "Time taken was $elapsed ns")
}
Here, we are having some COUNT number equals to 5 and we take the average of 5 values and then compute the time taken. But why only 5? Why can’t any other number? Also, there can be outliers or various other things that are running in the background and this will affect the measurement time.
So, from the above two examples, we can conclude that it is very difficult to measure the code performance because to find the average time taken we need to find how many times we should run the loop i.e. what should be the value of that COUNT variable? It is very tricky. These code measurement steps are called Benchmarking. Let’s dive deeper into it.
What is Benchmarking?
Form the previous section, I think you all have an idea about Benchmarking.
We can say that Benchmarking is a process that is used to measure how fast your phone can run something in it. The idea is to put your phone to enough stress so that you can find the maximum performance of your app on your phone.
So, in the previous section, we have seen how we can find or measure the average time taken by a piece of code to run in a device. But there were some issues with it. They are:
- It is often inaccurate because we are measuring the wrong thing in the wrong time.
- It is very unstable i.e. if we run the same code several times then chances are there that we get different values for each run.
- If we are taking out the average of all the values then how to decide the number of times that particular code will be executed before taking the result. You can’t decide this.
So, it’s hard to say how much time we are saving here because Benchmark is very tricky. Is there any option to find the real-time that a piece of code is taking during execution?
If there is a Problem then there must be some solution
And the solution to our problem is the Jetpack Benchmark Library :)
The Jetpack Benchmark Library
At the Google I/O’19, Android introduced the Jetpack Benchmark Library that can be used to remove all the error or difficulties that we were facing while naively doing the Benchmark process.
The Jetpack Benchmark Libray is a tool for measuring code performance and is used to remove those common mistakes that we were doing earlier while using Benchmark. This library handles warmup, measure your code performance and output the result in the console of Android Studio.
Now, the Benchmark code that we were measuring after 5 loops will be converted to:
@get:Rule
val benchmarkRule = BenchmarkRule()

@Test
fun codeMeasurement() {
    val worker = TestListenableWorkerBuilder<MyWorker>(context).build() //jetpack workmanager library
    benchmarkRule.measureRepeated {
        worker.doWork()
    }
}
All you need to do is apply BenchmarkRule and after that, you need to call an API i.e. the measureRepeated .
Now, let’s look into some other example. Here, we are taking the example of databaseBenchmark . So, in this databaseBenchmark, firstly, we will initialize the database and after that, we will clear all the tables and insert some testing data. After that, we will create our code measuring loop for measuring the code performance that we care about i.e. some database query.
@get:Rule
val benchmarkRule = BenchmarkRule()

@Test
fun databaseBenchmark() {
    val db = Room.databaseBuilder(...).build()
    db.clearAndInsertTestData()
    benchmarkRule.measureRepeated {
        db.complexQuery()
    }
}
But there is some issue with this code. Our query can be cached if we are not changing the values in the database then the query can be cached and we will get different result from the desired one. So, we can put the db.clearAndInsertTestData() inside the loop and by doing so in every loop we bust the cache and then measure the code that we are interested in. But here also, we are measuring more than what is required because we have one more statement in the loop. So, to remove this we can apply the previous approach i.e. count or find the time taken by db.clearAndInsertTestData() and then subtract this result with the final output.
@get:Rule
val benchmarkRule = BenchmarkRule()

@Test
fun databaseBenchmark() {
    val db = Room.databaseBuilder(...).build()
    val pauseOffset = 0L
    benchmarkRule.measureRepeated {
        val start = java.lang.System.nanoTime()
        db.clearAndInsertTestData()
        pauseOffset += java.lang.System.nanoTime() - start
        db.complexQuery()
    }
    Log.d("Benchmark", "databaseBenchmark_offset: $pauseOffset")
}
If you are not in a mood to write so many lines of code, then, there is one API available i.e. runWithTimeDisabled which will do the same but in a precise way.
@get:Rule
val benchmarkRule = BenchmarkRule()

@Test
fun databaseBenchmark() {
    val db = Room.databaseBuilder(...).build()
    benchmarkRule.measureRepeated {
        runWithTimeDisabled {
            db.clearAndInsertTestData()
        }
        db.complexQuery()
    }
}
Isn’t it simple and crisp? So, no more worries. Just use the Jetpack Benchmark Library and you are good to go with the Benchmarking. But how to integrate this in our Android Studio(the warehouse of every application)? Let’s see.
Integration with Android Studio
Since the Benchmark Library is in the alpha phase, we need to download the Android Studio version 3.5 or newer. We love modularization in our project and by default, we have app module and lib module. So, to use the Benchmark library, you need to enable the benchmark module and enable the Android Studio template for Benchmarking. Following are the steps to enable the benchmark module in Android Studio:
- Download the Android Studio 3.5 version or higher.
- In Android Studio, click on Help > Edit Custom Properties .
- Add the code: npw.benchmark.template.module=true
- Save and close the file.
- Restart Android Studio.
Now, we can make a Benchmark module other that app and lib module. The Benchmark module template will automatically configure settings for Benchmarking. To create a Benchmark module, do the following:
- Right-click on your project or module and select New > Module .
- Select Benchmark Module and click Next .
- Enter your module name and language(Java/Kotlin) and then click on Finish .
Image source: Android website
By following the above steps, a module will be created that is pre-configured for benchmarking, with a benchmark directory added and the debuggable is set to false . Here, by setting the debuggable to be false, we prevent using debugger with our tests.
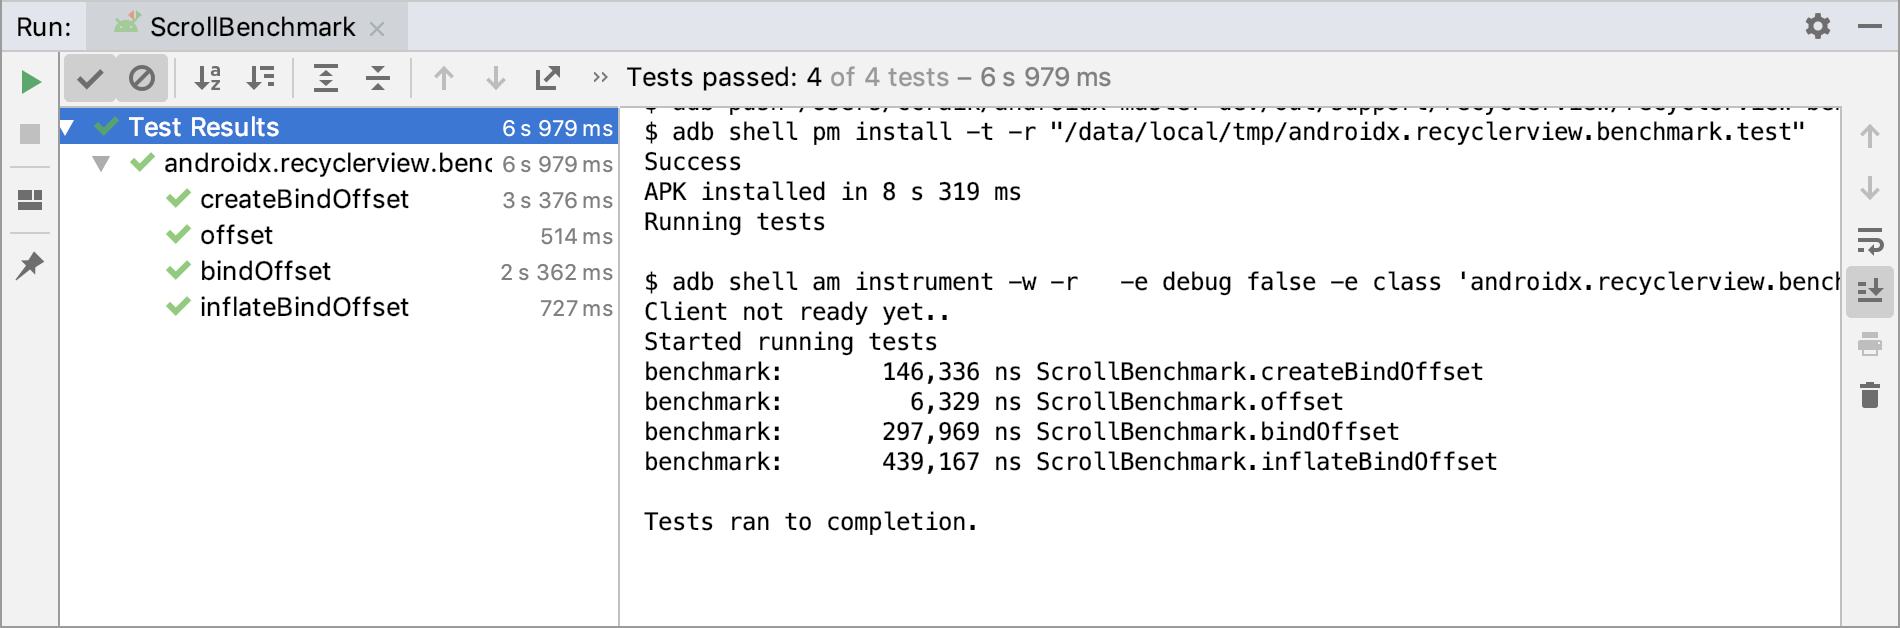
To run the benchmark, in the module, navigate to benchmark/src/androidTest and then press the ctrl+shift+F10 (or cmd+shift+R on mac). Here is the result of the same:
Image source: Android website
Benchmark Configuration
Since we are making a module for Benchmark and with any module we have one build.gradle file. Same is with the benchmark module. The build.gradle file of benchmark consists of:
- The benchmark plugin: It will help you to pull your benchmark reports when you run gradlew.
- Custom runner: Custom runner i.e. the AndroidbenchmarkRunner will help to stabilize your benchmark.
- Pre-built proguard rules: This optimizes your code
- The library itself (alpha version, as of now)
The code of the build.gradle file looks like:
apply plugin: 'com.android.library'
apply plugin: 'androidx.benchmark'

android {
    defaultConfig {
        testInstrumentationRunner "androidx.benchmark.junit4.AndroidBenchmarkRunner"
    }

    buildTypes {
        debug {
            debuggable false
            minifyEnabled true
            proguardFiles getDefaultProguardFile(
                    'proguard-android-optimize.txt'),
                    'benchmark-proguard-rules.pro'
        }
    }
}

dependencies {
    ...
    androidTestImplementation "androidx.benchmark:benchmark-junit4:1.0.0-alpha05"

}
Also, in the AndoridManifest.xml file, you need to set the debuggable to be false.
<!-- Important: disable debuggable for accurate performance results -->
<application
android:debuggable="false"
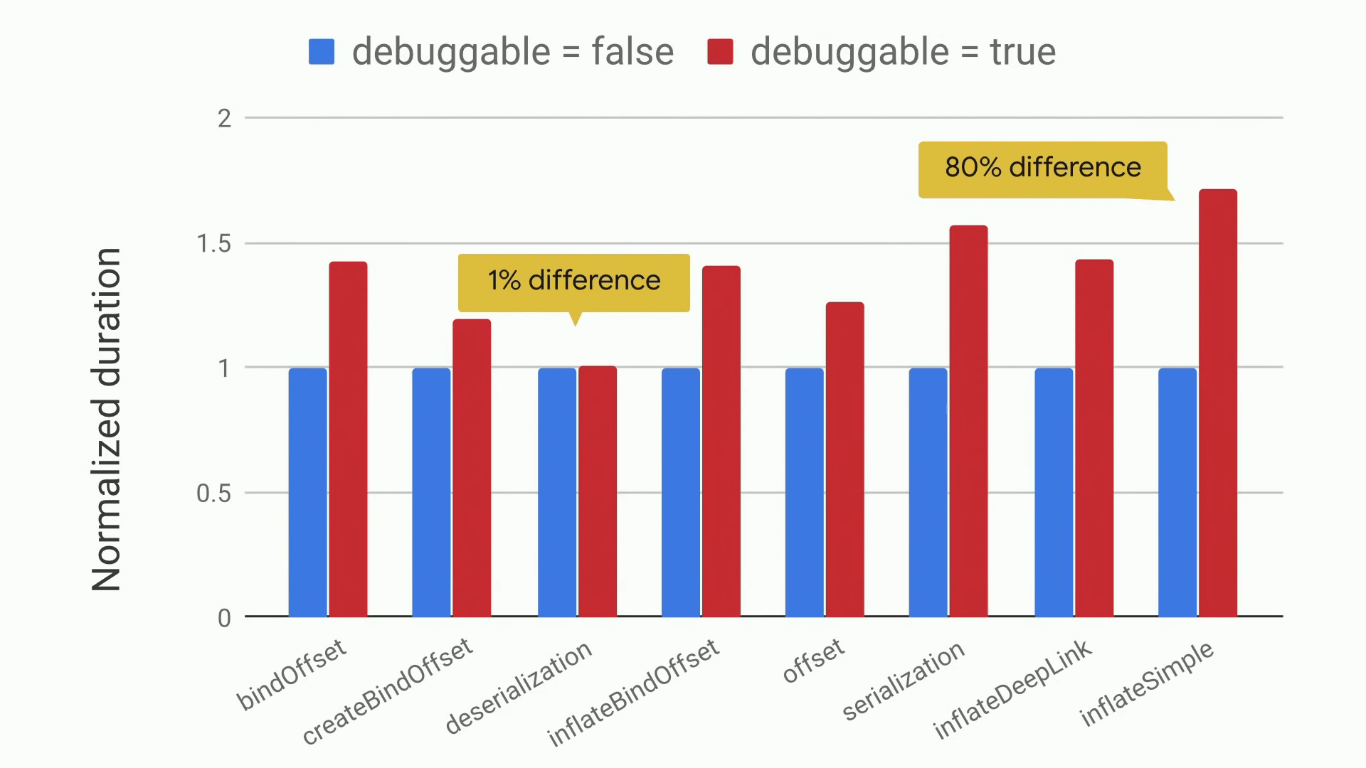
tools:replace="android:debuggable"/>You need to set the debuggable to false so that you can prevent the debugger to use your test. Here is a quick difference between the two i.e. when the debuggable is set to true and when it is set to false.
Image source: Google I/O'19
Apart from the debuggable, you can also set the codeCoverageEnabled to false .
So, we are done with benchmarking. But here is one question, can we use the Jetpack benchmark Library in every situation i.e. is the library producing the same result in every case? The answer is no. But don’t worry, the library will inform you if something is affecting the benchmark. Yes, we have warnings in the benchmark library. So, next time when your debuggable is set to true or you are using emulator or missing some runner or if you are low on battery then the benchmark will give you some warning and you can look out on it and fix it before benchmarking.
Factors affecting Benchmarking
Performing a benchmark task is not that easy as it seems to be. There are various enemies to it and the greatest one is the CPU clock. The CPU clock is very responsible for stability. To be more precise, the CPU clock problem is further divided into two problems i.e.
- Ramping
- Throttling
Ramping
We all know that when the device is in ideal situation i.e. no work is being assigned then the clock is low and when some task is assigned to it then it starts ramping to high-performance mode. So, in general, clocks will generally increase under load.
So, if we are measuring under these two situations then we are likely to get a wrong output for the code measurement because the clock is different in these cases.
The solution to this problem is very simple and it is present in the definition of benchmarking. The Benchmark library runs warmup to stabilize this i.e. the loop of benchmarking will run for a minimum of 250ms and after that, the measurement will be done. So, if the clock is in a low state then in that 250ms, the clock will come into the preferred state and the measurement will be taken.
Cool, we are done with the first problem. No, it is not cool, it is hot and our second problem also arises due to the temperature of the device.
Diving or Throttling
When your device is working so much then it gets hotter and the clock dives quickly. In general, the CPU lowers the clock when the device is hot to avoid damage to the chips. This is also called thermal throttling. So, this can massively affect the benchmark performance because on a certain instance the clock is very high and at the next instance the clock is very low. Following is an example of Thermal Throttling (red line):
Image source: Google I/O'19
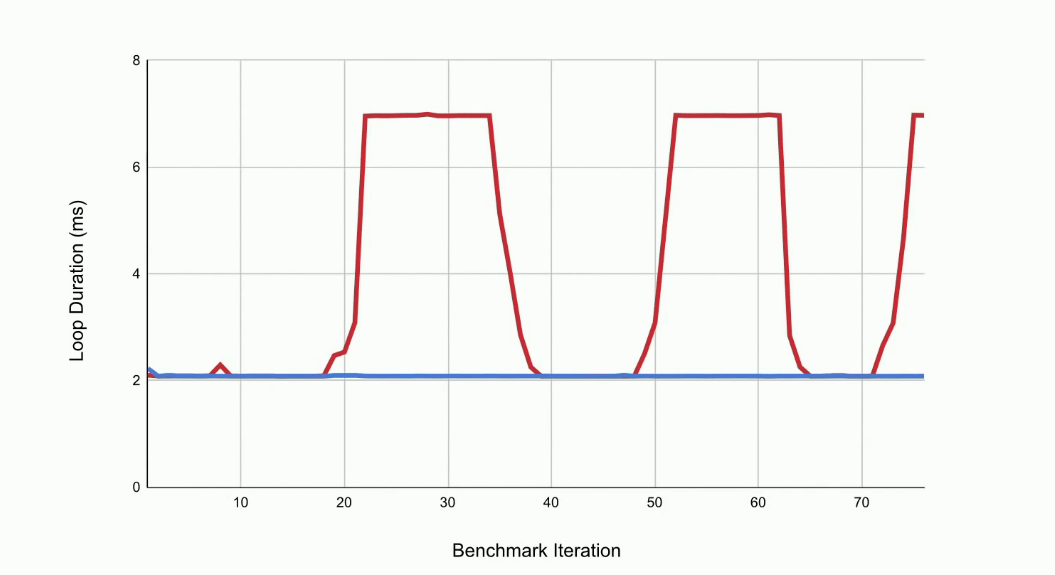
Here, at one instance, we have a lot to do and the CPU clock is high. But at the same time when the device gets hot, the CPU lowers the clock and after some time due to the pending work, the clock again goes to high. So, we can’t trust the measurements taken in between these clock cycles.
There are various solutions to this Thermal Throttling problem. They are:
- Clock Locking
- Sustained Prefernce
- Thread.sleep()
One solution can be clock locking. So, you can Lock Clock and then measure the code. But this is not ideal as it requires the device to be in rooted form. Also, we have some gradle plugin to lock clock i.e.
./gradlew lockClocksBut this requires the device to be rooted . So, this is not a general solution.
Another solution is Sustained preference. There is an API called Window.setSustainedPerformanceMode() which is generally made for VR/games and it can be used in benchmarking because it lowers the max clocks which prevent throttling. But this also has some demerits:
- It requires Activity that is running with some flag set.
- It can work in single or multithreaded mode.
- Lastly, it supports only a limited number of devices.
So, let’s find the solution to these three problems.
For the Activity flag part, what we do is we inject an Activity whenever we are testing something and after that, we set a flag on all the activities that the user has launched. By doing so our Activity flag difficulty can be solved.
For the Single and Multithreaded problem, we have to force the device to the multi-threaded mode because either you can use one core at a max clock or multiple cores at the lower clock. But switching modes can result in inconsistency. So, we should force the device to multi-threaded mode. To do the same, in our AndroidBenchmarkRunner, sustained performance mode is in use, we create a new thread that will spin. This is the best way to force into the multi-threaded mode.
//AndroidBenchmarkRunner.kt

override fun onCreate(arguments: Bundle) {
    super.onCreate(arguments)

    if(sustainedPerformanceModeInUse) {
        thread(name = "BenchSpinThread") {
            Process.setThreadPriority(Process.THREAD_PRIORITY_LOWEST)
            while(true) {}
        }
    }
}
Now, the third and the last problem is that the Window.setSustainedPerformanceMode() is available only for a limited number of devices. So, to check if your device supports this or not, you can do so by:
PowerManager.isSustainedPerformanceModeSupported()So, till now we have seen two methods i.e. Clock Locking and Sustained Preference, but both of these methods can’t be used in the normal case because all devices are not rooted and also all devices don’t support Sustained Performance Mode. We need some concrete and general solution. So, here is the final solution for throttling i.e thread sleeping and this the simplest solution.
In the Thread.sleep() method, we detect a slowdown by running a tiny-mini benchmark in between every benchmark to see if the device has started thermal throttling or not. If there is a thermal throttling then we discard the current benchmark data and we sleep to let the device cool down.
Below is the comparison of the clock before and after using Thread.sleep() .(blue line represents the situation after using Thread.sleep())
Image source: Google I/O'19
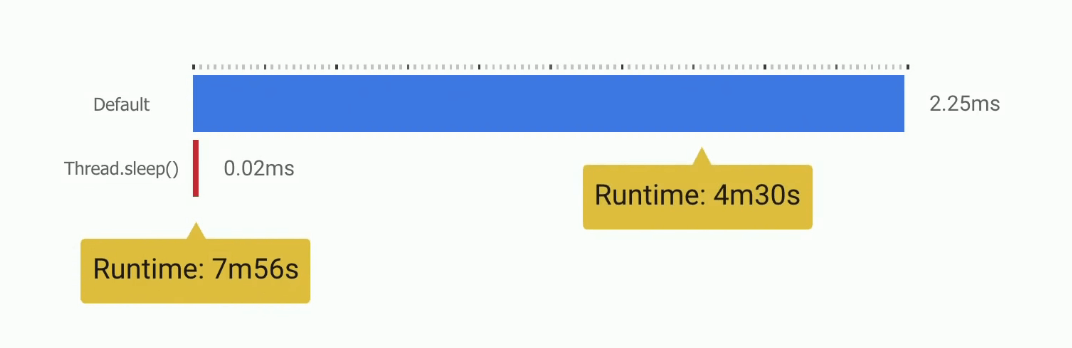
But because we are sleeping whenever there is a thermal throttling, the runtime will be increased due to Thread.sleep() .
Image source: Google I/O'19
Don’t Benchmark everything
We have seen that with the help of benchmarking we can measure the code performance but it is recommended that we shouldn’t benchmark everything. Start with tracing or profiling tools or you can perform some measurement on your real device that tells you which particular part of your device is slow. If you are benchmarking then you should benchmark synchronous and small blocks.
Also, before using a benchmark, you should be aware of the caches that are present in your code. Here is a simple example of a benchmark that loads a file and checks if it exists or not.
@get:Rule
val benchmarkRule = BenchmarkRule()

@Test
fun myBenchmark() {
    val file = File(path)
    benchmarkRule.measureRepeated {
        file.exists()
    }
}
In the above code, the OS will note the address of the file and it will assume that nothing will be changed. So, it will be there in the cache and every time you will be served a cache value. So, the benchmark will be very different from the startup time. Keep a note of these things.
Closing Notes
We have seen that Benchmark is a very complex problem i.e. it is very hard to measure the code performance normally. It depends on the Clock Stability. So, to solve these problems we have Jetpack Benchmark Library API that can measure the code performance for you. And remember one thing, Do Not Compare Devices with JetPack Benchmark. Here, we are comparing code written for the same device and same OS version. To learn more about benchmark, you can visit the Benchmark website and for benchmark code samples, you can visit the Github page . Hope you learned something new today.
Do share this blog with your fellow developers to spread the knowledge. You can read more blogs on Android on our blogging website .
Apply Now: MindOrks Android Online Course and Learn Advanced Android
Happy Learning :)
Team MindOrks!