How to use Memory Heap Dumps data?

Whenever we develop some Android application then the most common thing that all the developers are worried about is the usage of memory by the application. This is because if your application is using large memory then you may lose your users as the majority of the population use low memory devices. The developers try to find each and every memory leak present in the application so that they can optimize their app to be leaner and faster. Also, if you get to know which objects are using memory at a particular instant of time then it becomes an easier task for you to remove memory leaks in your application.
In this blog, we will be learning how to use memory heap dumps data to identify memory leaks. So, let's get started.
About Profiler
In Android Studio, we have something called Profiler that provides the CPU, memory, network, and energy usage information of our application. This shows a graphical representation of the usage of CPU, memory, network, and energy by our application. With the help of this data, we can optimize our code. But out of these four i.e. CPU, memory, network, and energy, the one that is mostly used by every developer is Memory Profiler. So, let's see what this Memory Profiler is and before that, we will learn the reason for memory leaks and then try to identify that with the help of Memory Profiler.
The Problem
Memory Profiler helps us in finding memory leaks and memory churn.
A memory leak is an object which becomes inaccessible to the running program but still occupies memory.
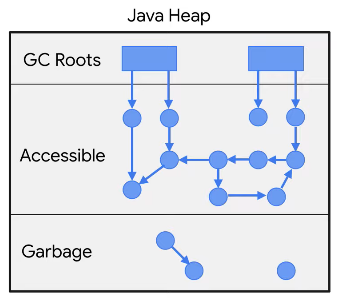
But in Java or Kotlin, we have something called Garbage Collection. When your app is no longer using some objects, the garbage collector releases the unused memory back to the heap. For the process of garbage collection, the JVM will first identify the Garbage Collection Root(GC Root) which is an object that is accessible from outside the heap like running thread and local variables. Then all the objects that are accessible from the Garbage Collection Root are identified and these objects are retained. And finally, the rest of the objects that are not accessible from the Garbage Collection Root are considered as garbage and they are recycled.
So, where does the concept of Memory Leak come?
Life was good till we were not introduced with memory leaks.
Memory Leaks come into play when your object is not yet destroyed but at the same time, you are not in a position to use that object. So, your object will hold the memory and you will not be able to use that memory.
In other words, we can say that memory leaks come into play due to abandoned objects that can never be used in the program but it is accessible.
The Solution
To find memory leaks in our application we can use the memory profiler. To open memory profiler in our application, follow the below steps:
- Click on View > Tool Window > Profiler .
- Run your application on the target device.
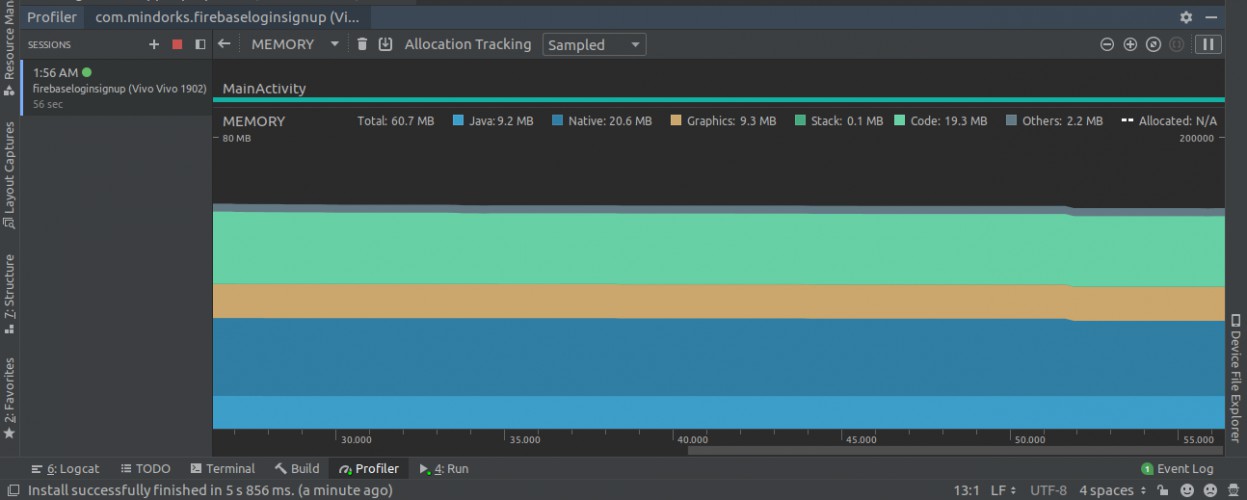
- You will see the graph of CPU, memory, network, and energy usage. Click anywhere on the memory timeline to open Memory Profiler. The following screen will be opened:
From here, you can avoid memory leak for two types of objects(mainly) i.e. Activity and Fragment. We are concerned about these because they often consume a lot of memory. The best thing is that you need not detect the leaks manually, from Android Studio version 3.6 or higher, the memory leaks of activities and fragments are detected by Memory Profiler. Since these two classes have a real defined behaviour. So, how can a profiler tell that these classes have a leak? For Activity, if it has been destroyed but is still referenced then there is a leak. For Fragments, if we don't see a FragmentManager associated with it and it is still referenced, then it is the case of leak.
So, to identify a leak, due to some activities or fragments, the very first thing we need to do is capture the heap dump. Let's see how.
Memory Heap Dump
A heap dump is used to find which object in our app is using memory at the time of capturing the heap dump. A heap dump can help us in identifying memory leaks by showing objects that are still in memory and that is not going to be used by the program. By capturing the heap dump, you can get the following information:
- Memory used by each object.
- Reference of each object that is being held in the code.
- Type of object that is allocated by our app.
- The call stack for where an object was allocated.
To capture a heap dump, you have one option called "Dump Java heap" in the Memory Profiler. Click on it.
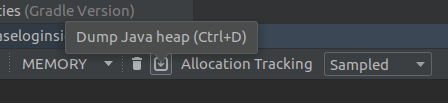
The following screen will be displayed to you:
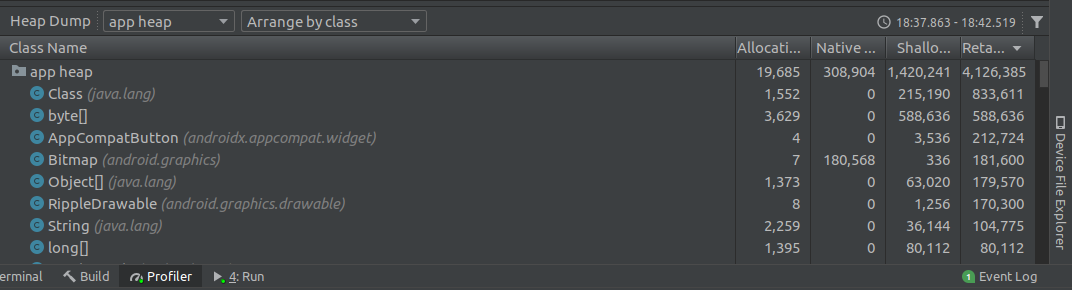
We have lots of data with us. There are four classes that are made available to us. They are:
- Allocations: It shows the number of allocations or instances in the heap.
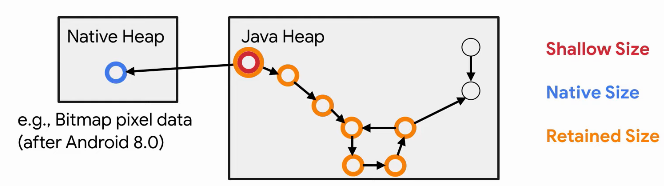
- Native Size: It is the total amount of native memory(in bytes) that is used by this object type (only visible for Android 7.0 or higher).
- Shallow Size: It is the memory(in bytes) consumed by the object itself.
- Retained Size: It is the memory(in bytes) that is used due to all the instances of this class.
So, by using this data, you can identify the classes that are worth attention. If you click on any of the class names, then the Memory Profiler will open an Instance View showing a list of the instance of this class.
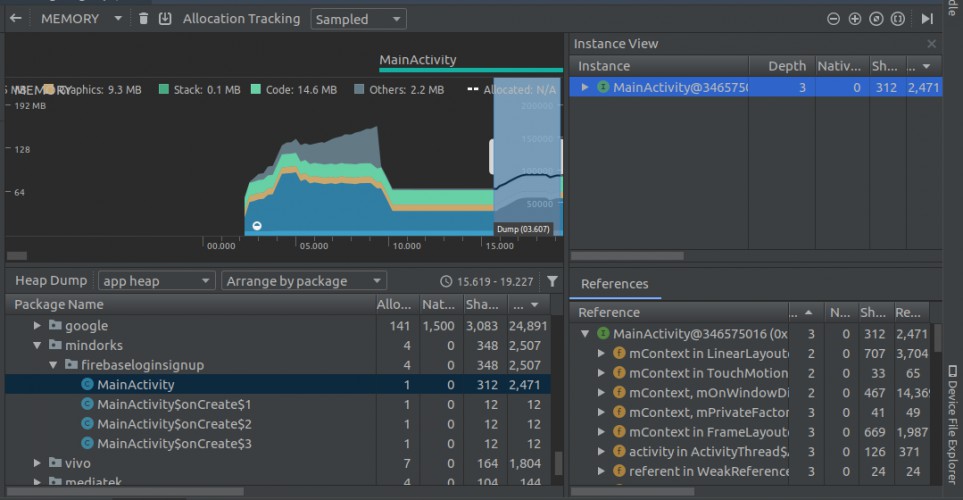
Here, you will find one new data i.e. the depth. The depth is the shortest number of hops from any Garbage Collection Root to the selected instance. The closer an object is to the Garbage Collection Root, higher chances are there for having multiple paths from the GC Root to this object and a lower chance to be garbage collected.
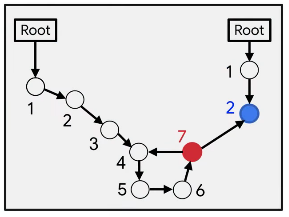
In the above example, for the red node, if any of the references to the left is broken, the red node will be inaccessible and it will be garbage collected. But for the blue node, if you want garbage collection, then you have to break the path from the left as well as right.
Example
While using any listener, we should always unregister the listener when not in use because if we are not doing this then the listener will be there in the GC Root and it will never be garbage collected. So, always try to unregister the listener in onPause() or onStop() or onDestroy() method. Following is an example of LocationListener:
public class LocationListenerActivity extends Activity implements LocationUpdate{

  @Override
  public void onLocationChange(Location location){

  }

  @Override
  public void onStart(){
   LocationListener.get().register(this);
  }

  @Override
  public void onStop(){
   LocationListener.get().unregister(this);
  }

}
If you are not unregistering the listener then in the dump java heap, you will see a status that says that we are having a memory leak due to the LocationListener.
That's how you can use the data from the heap dump of the Memory Profiler to find leaks and then optimize and correct the code for better results.
Hope you learned something new today.
Have a look at our Android tutorials here .
Do share this blog with your fellow developers to spread the knowledge. You can read more blogs on Android on our blogging website .
Apply Now: MindOrks Android Online Course and Learn Advanced Android
Happy Learning :)
Team MindOrks!
Also, Let’s connect on Twitter , Linkedin , Github , and Facebook