Understanding Memory Usage In Android
Memory plays an important role in making an Android application famous. Less the memory requirement of an application, faster the app will run on a particular device. These things come into play when we are using an entry-level device. And we know that most of the Android users are using the entry-level devices. So, to have a better user experience and to strengthen the Android ecosystem, you must understand the memory usage of your application.
So, in this blog, we will understand the Android memory usage. The whole blog can be divided into five parts:
- Why care about memory usage?
- How memory use impacts a device?
- Evaluating application memory impact.
- Reducing your application’s memory impact.
- Closing notes.
So, let’s get started.
Why care about memory usage?
Before understanding the memory usage of your application, we should know why to care about memory usage?
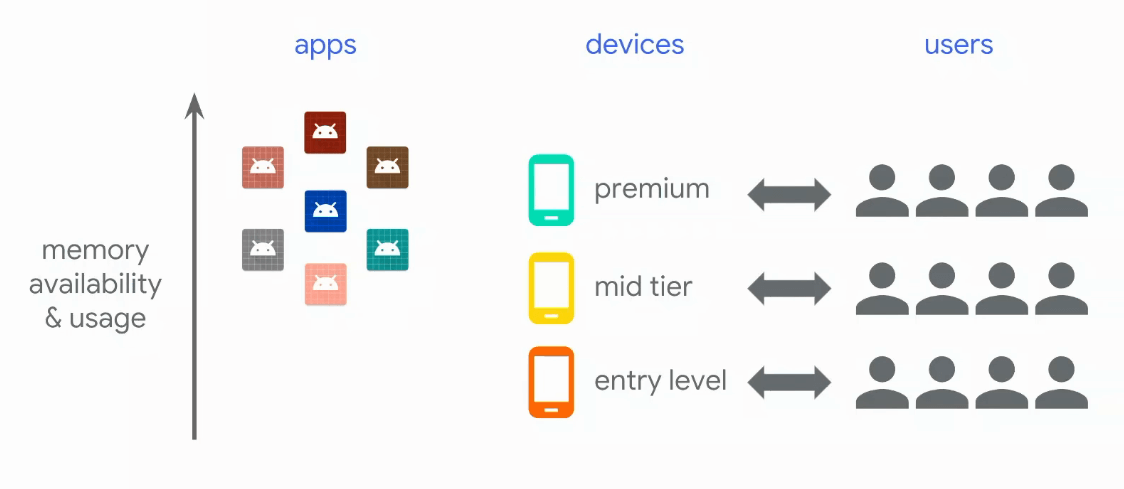
So, basically, there are three types of Android devices i.e. entry-level devices , mid-tier devices , and premium devices . Out of these three types of devices, the entry-level devices have low memory and it can run only those applications that require low memory. So, if the memory usage of application increases then it will be difficult for the entry-level devices to run that application and as a result, you will lose your users. Since entry-level devices are large in number so this memory problem is affecting a large group of users. This will affect the Android ecosystem(i.e. a collection of apps, devices, and users).
Image source: Google I/O 18
So, Android app developers have a role to play when they are developing their application to do whatever they can, to be efficient in the memory use and to reduce the memory use.
How memory use impacts a device?
In this section, we will see how high memory requirement impact a device. In general, the memory of the Android device is divided into pages and each page is around 4 kilobytes. There are three types of pages:
Image source: Google I/O 18
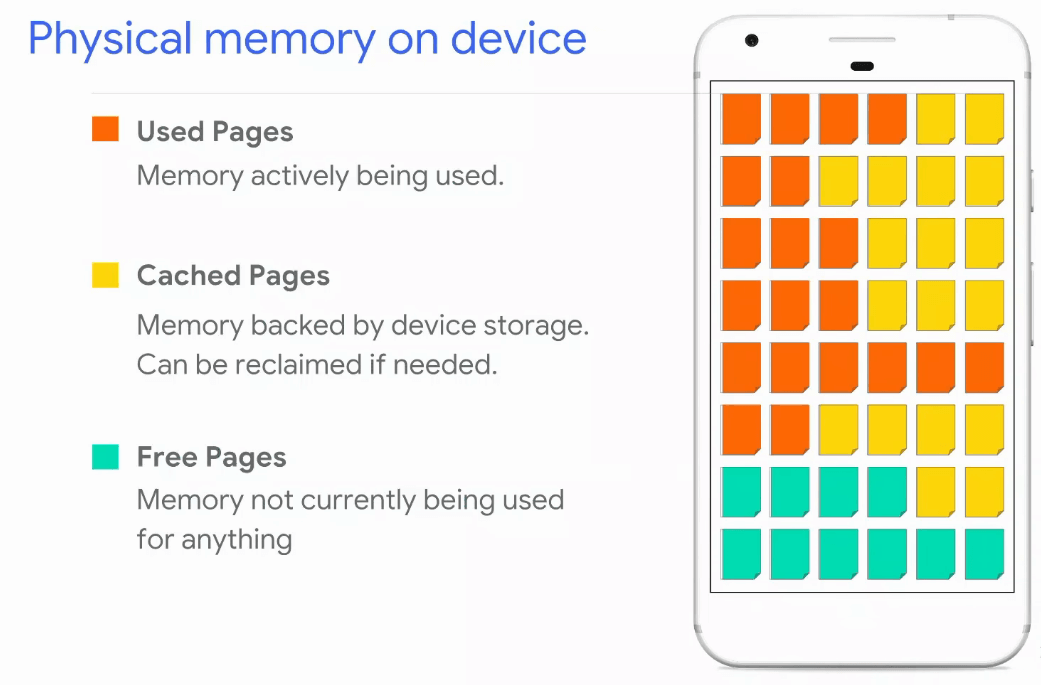
- Used Pages: These are the pages that are currently being used by the processes.
- Cached Pages: These are the pages that the processes are using but some part of the memory is also present in the main memory. So, to have a fast retrieval of data, we use cached pages.
- Free Pages: These are the pages that are free i.e. these are the memory space that can be used to store something in the future.
Now, let’s see what is the impact of memory pressure on devices. The following graph shows the memory usage during the course of time. So, in the beginning, there is nothing to run but with the due course of time, we started using more applications and this, in turn, use more and more memory over time.
Image source: Google I/O 18
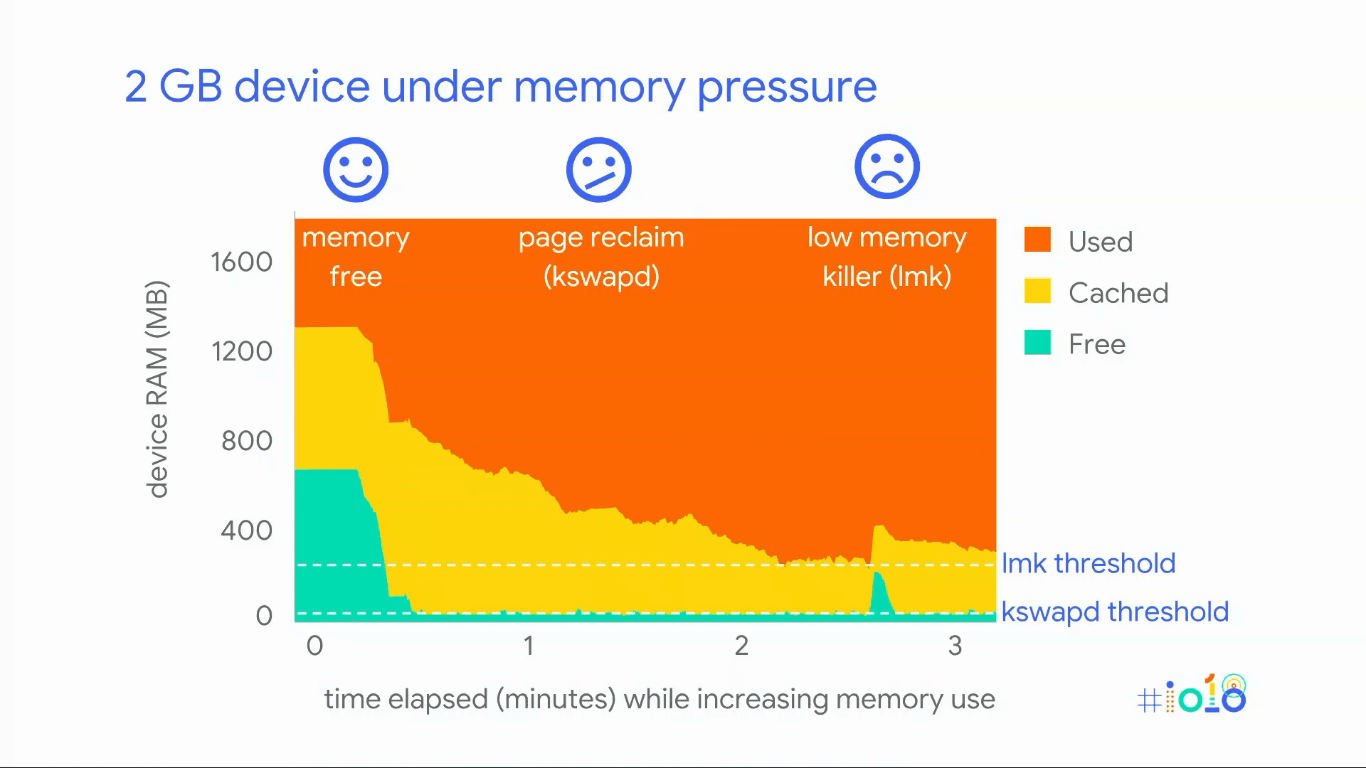
From the above graph, we can see that in the beginning, when the device started running then there is a lot of free memory available. But when we start using other applications then the free memory is being used and to avoid something bad that can happen due to low memory, the kernel performs an operation called kswapd .
In the process of kswapd , if the memory of the device goes down the kswapd threshold , then the Linux kernel starts finding some more free memory. So, what is does is, it reclaims the cached pages and make it free. But the problem here is that if an app wants to reclaim the memory present in the cached pages then it will take some time because at present there is nothing in the cached page and data will be loaded from the device storage.
But what if we continue using more and more application. In this case, due to the process of kswapd , more cache memory will be cleared and a time will come when the device starts to thrash. And this is a very bad thing because the device will be completely locked up.
In Android, we have a process called low memory killer , and this will pick a process from the device and will completely kill that process. By doing so, you will get back all the memory that the process was using. But what if the low memory killer , kills the process that the user cares about?
In Android, we have a priority list of applications and based on that priority list we remove the app when the low memory killer comes into play. Following is the priority list in Android:
Image source: Google I/O 18
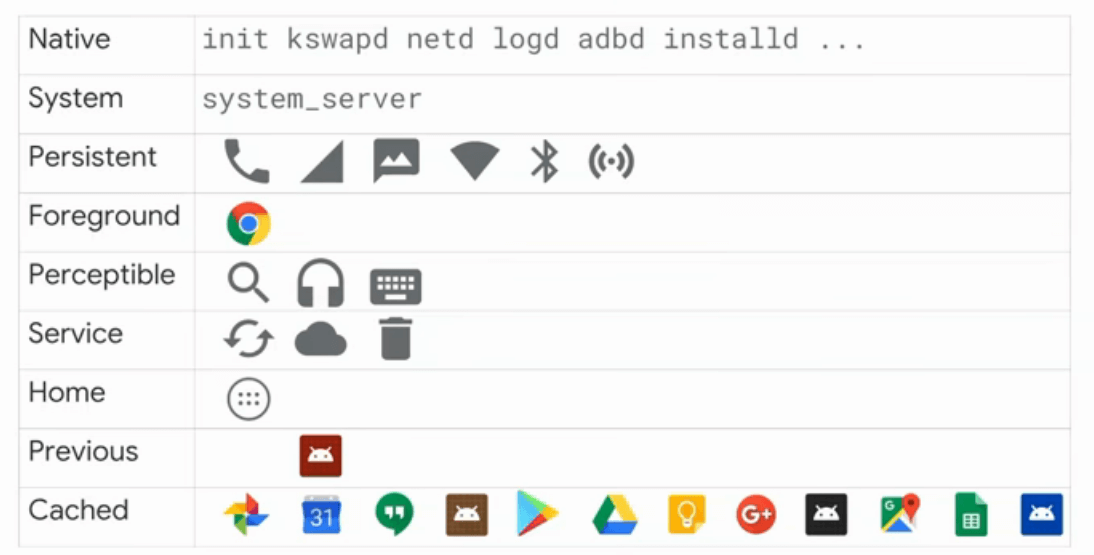
So, whenever the low memory killer comes into play, then it first deletes the cached applications. Even after that, the memory usage keeps on increasing then the low memory killer kills the previously opened applications. So, now if the user wants to open the previously opened applications then it will take some time to launch that application because it is not present in the cached memory. Again if the memory usage keeps on increasing, then the home application will be killed and after that service, perceptible, foreground and persistent apps will be stopped or killed. Again, if the memory usage keeps on increasing, then the system app will be stopped and your phone will be rebooted :( This is the worst user experience that we can have in low memory devices or entry-level devices.
The example that we took was a 2GB device. The situation becomes worse when you are having a 512MB device.
Image source: Google I/O 18
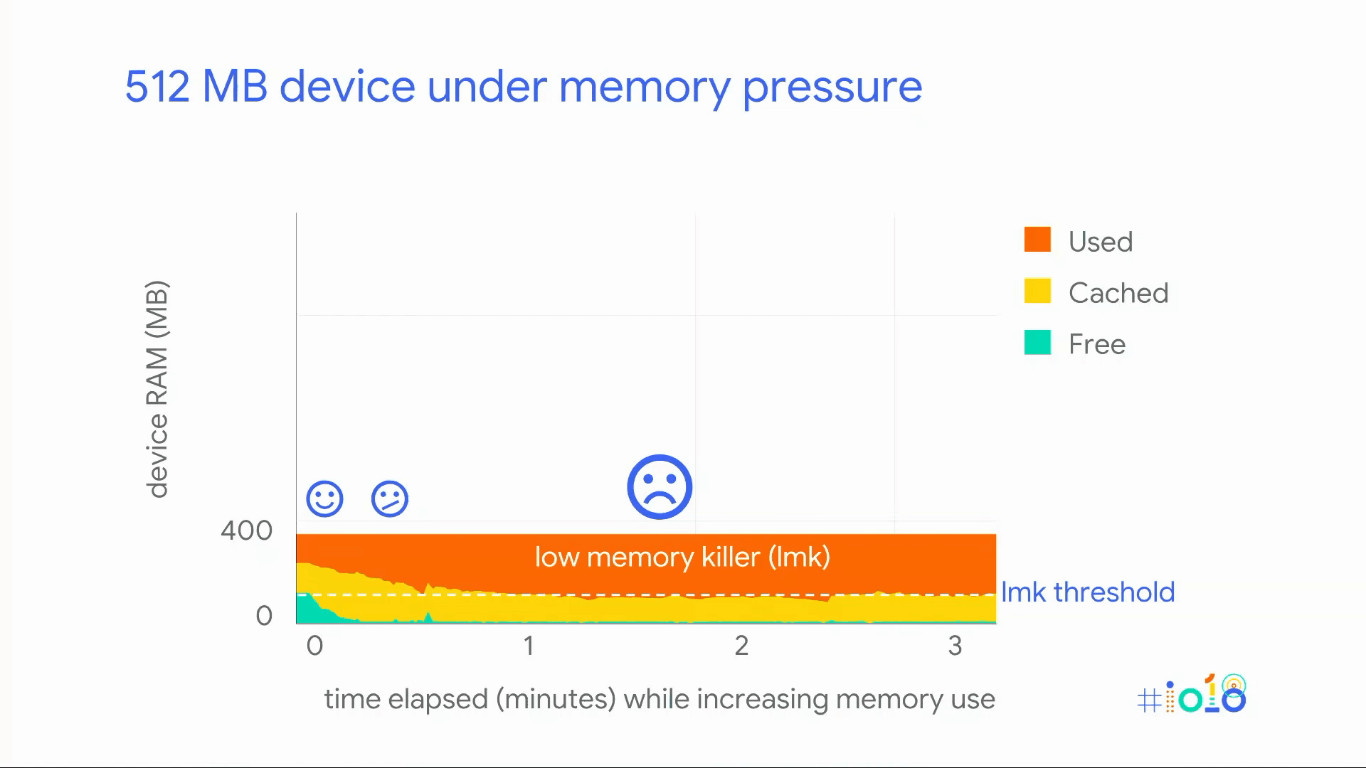
In the above example, we have very less memory and due to this the kswapd and low memory killer will come into play very earlier. So, low memory killer will always be active and this will result in bad user experience and we should try our best to develop an application which can perform well in low memory situations also.
Evaluating application memory impact
In this section, we understand how to know what is the memory impact of our application on some devices, maybe on some entry-level devices.
In the above section, we have seen that the memory of the device is divided into pages and the Linux kernel system keep a track of the pages used by a certain application.
Image source: Google I/O 18
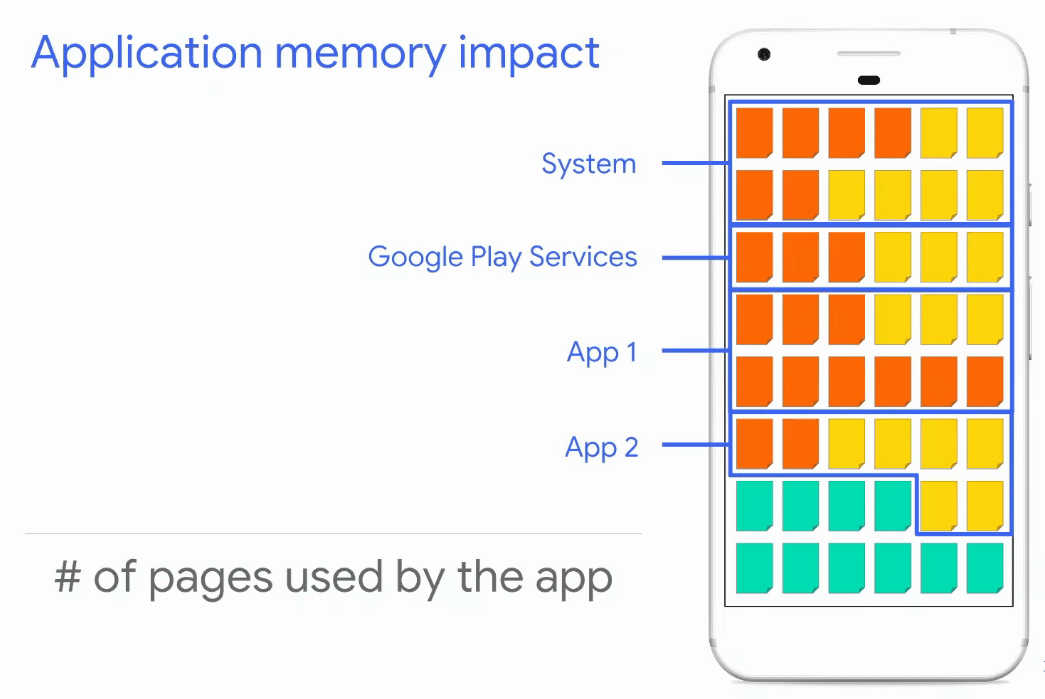
But the situation gets worse when the application starts using some shared memory. For example, you can have an application that calls the Google Play Services and this, in turn, result in page sharing between these two applications.
Image source: Google I/O 18
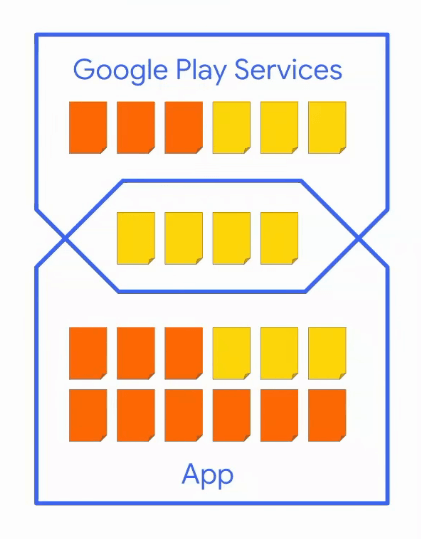
So, the problem that arises here is how to deal with this shared memory. Is the application responsible for the shared memory or the Google Play Service is responsible for this shared memory? There are a few different ways, that can be used to deal with these situations:
- RSS (Resident Set Size): In this method, the application is responsible for all the shared memory i.e. in our example the Google Play Service will have to do nothing and the app that is using the Google Play Service will be responsible for memory sharing.
- USS (Unique Shared Set): Here, the application is not responsible for any of the shared pages.
- PSS (Proportional Set Size): Here, the app will be responsible for that number of pages that are proportional to the number of processes sharing the shared memory. For example, if the shared memory contains 4 pages and the memory is shared among two processes then the app will be responsible for only two pages. If the shared page is 4 and the number of sharing processes will be 3 then the app will handle 4/3 pages.
So, which method to choose from the above? The choice depends on the usage of shared memory. For example, if the shared memory is being used by the application only then we should use the RSS approach. While, if the shared memory is taken by the Google Play Services then we should use the USS approach.
But in general, it is very difficult to find if the app will require shared memory or not. So, we use the Proportional Set Size method. PSS avoids over-counting or under-counting the overall impact of shared pages on a device.
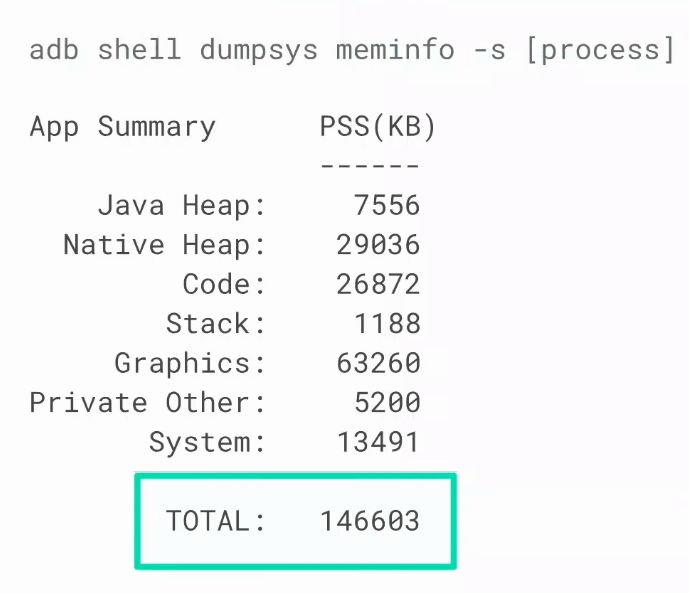
So, we can use PSS to find your application’s memory impact and to find the PSS value of your application, you can run the below command:
abd shell dumpsys meminfo -s [process]Here, your process name can be com.example.android.example .
So, when you run the above command then you will get something like below and the total value here is the PSS value of your process.
Image source: Google I/O 18
The point that needs to be noted here is that there are various other factors that are responsible for the performance of the app. They are:
- The application use case
- The platform configuration
- The device memory pressure
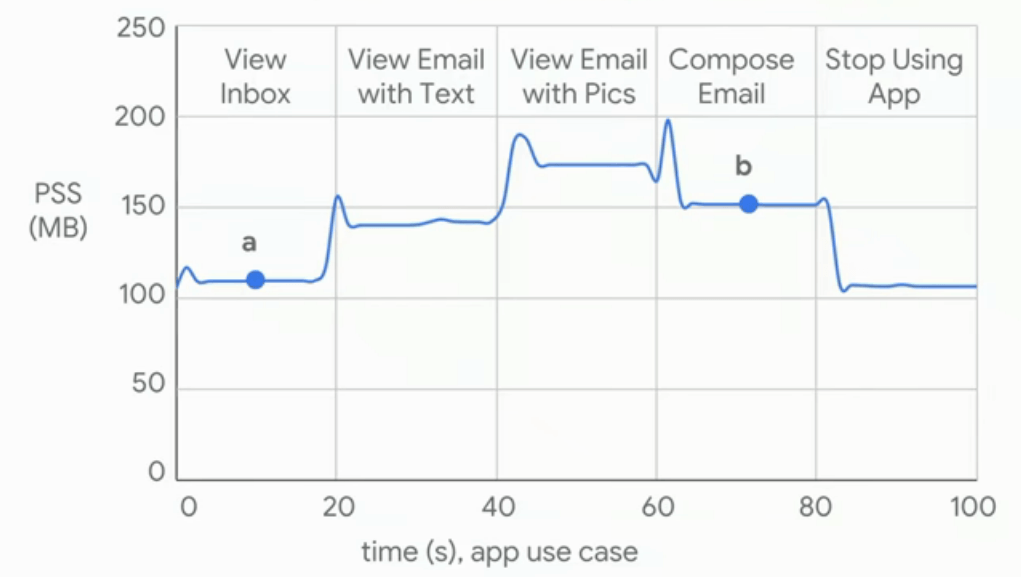
You shouldn’t only depend on the PSS value. But you should also care about the application use-case. For example, in the following graph, there are various use-cases of the Gmail application. You can see that you can’t compare the PSS value of point a with point b because these points are in different use-case.
Image source: Google I/O 18
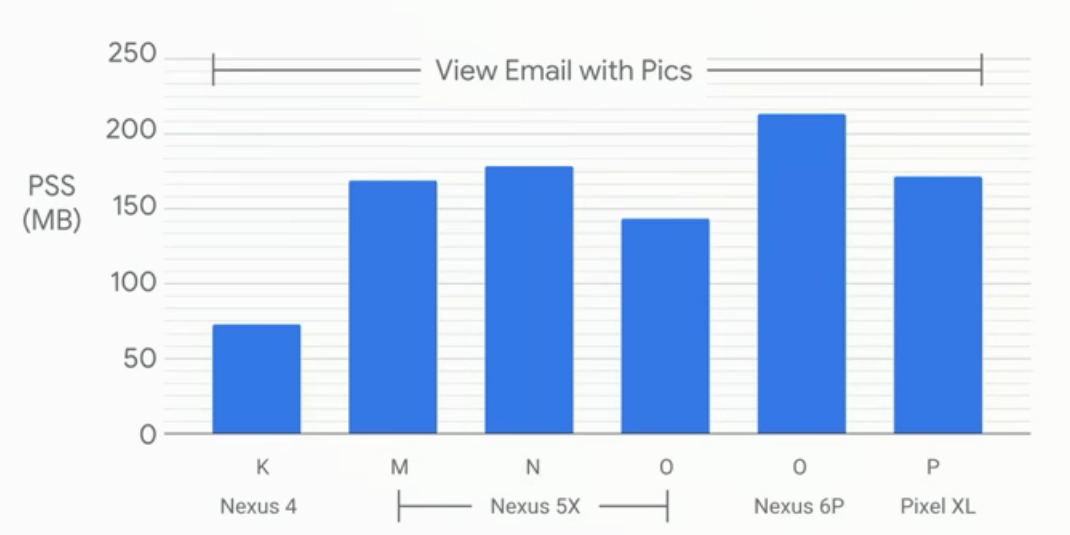
Also, your device performance will be dependent on platform configuration i.e. the premium device can perform more in comparison with the entry-level devices. Also, it depends on the Android version. So, when you are testing an application, then you should use a particular device and a particular Android version.
Image source: Google I/O 18
Lastly, the impact of memory depends on memory pressure. For example, in the below figure, we stared the chrome application and since there is no memory pressure the PSS value is constant but eventually when the pressure on the device increases that is more and more applications are in use, then kswapd comes into role and some of the cached pages will be killed and there will be a decrease in the PSS value.
Image source: Google I/O 18
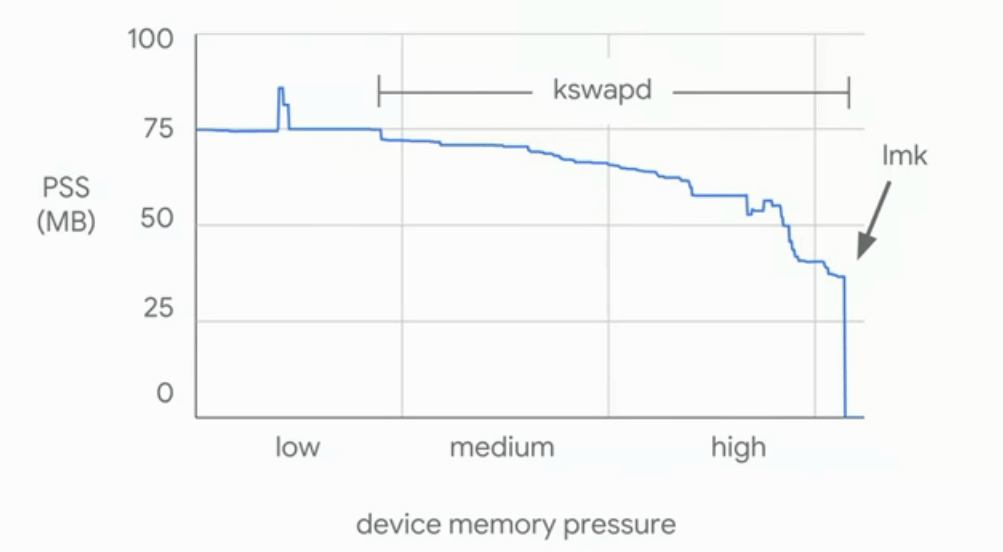
So, it is advised to use some devices that are having enough memory(RAM) so that the high-pressure memory doesn’t come into play.
Reducing your application’s memory impact
Till now, we have seen how memory use impacts a device. Also, we saw how to evaluate the application’s memory impact. Now, it’s time to find ways that can be used to reduce your application’s memory impact. Let’s see how we can do this.
The very first tip to reduce your application’s memory impact can be checking the Android Studio’s memory profiler.
Image source: Google I/O 18
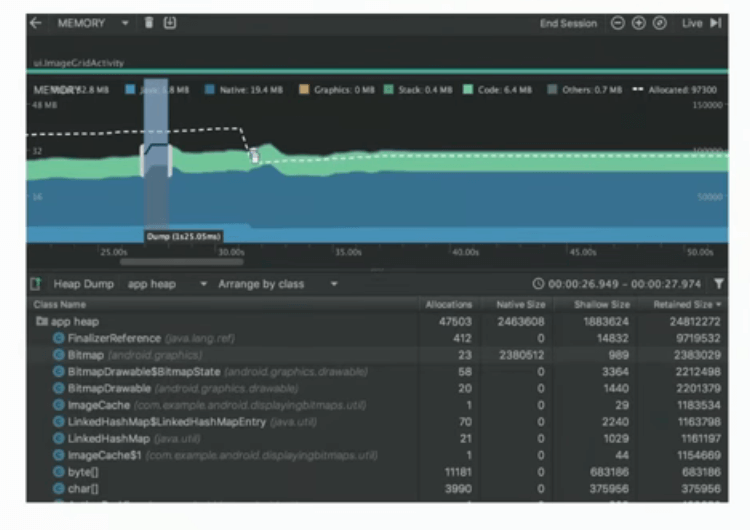
This will give you a ton of information i.e. you will come to know about your java object, where are they allocated, what’s holding on to them and almost everything that you can find about your Java object.
While finding the PSS value, we only considered the Java heap. But what about other factors that are responsible for reducing your application’s memory impact.
Image source: Google I/O 18
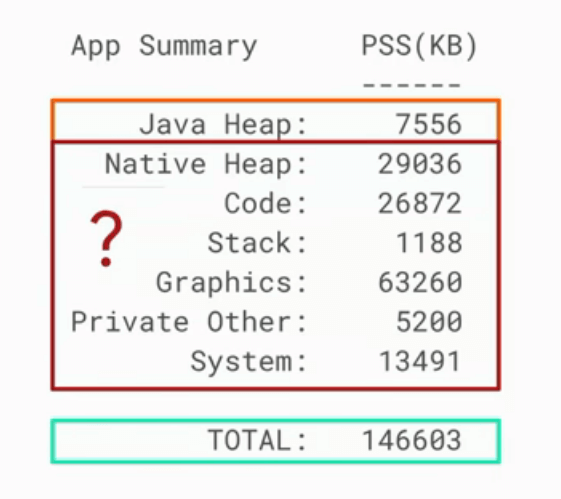
These things depend on the Android platform. To get full information of the PSS value, you can use -a in the dumpsys command:
dumpsys meminfo -aThis will give a much more detailed breakdown of the PSS value. It will also show you the breakdown of different categories of memory like private, clean, share, dirty and so on.
If the above information is not useful then you can use showmap in your application and this will give more breakdown of your memory mapping. These platform commands can be used but the problem here is that:
- These tools aren’t well supported
- The user interface is clumsy
- You need deep platform expertise
- May need a rooted device
So, the idea here is that the information shown to you is not that useful or you need to be an expert to understand those reports. So, this is not going to be a good tool. What to do next? Is there any way? Yes, if you want to improve your overall memory use then you can do two things:
- Profile your Java heap: You can profile your Java heap with the help of Android Studio Profiler. Since the allocations that are outside the Java heap are tied to Java allocation. So, your application will be calling the Android framework, the Android framework is calling into the native libraries and this is doing native allocations. The lifetime of these will be tied to Java objects. So, just profile your Java heap.
- Reduce your APK size: You can reduce the APK size of your application because there are a lot of things that are present in APK and this, in turn, affects the runtime. So, try to reduce the APK size of your application. To reduce the APK size, you can visit the Android developer website .
Closing Notes
In this blog, we understand Android Memory usage. We saw how the memory use can impact a device and at last, we saw how to reduce your application’s memory impact. One thing that can be noted here is that you have to compromise between memory usage and user satisfaction because if your application is using very low memory then the features of the app will be less. Similarly, when the features are high then the memory use is also high. Also, with due respect of time, the size of the app increases i.e. the app size in 2017 will not be same in 2019. So, these things also come into play.
Hope you learned something new today.
Do share this blog with your fellow developers to spread the knowledge. You can read more blogs on Android on our blogging website .
Apply Now: MindOrks Android Online Course and Learn Advanced Android
Happy Learning :)
Team MindOrks!