How to deobfuscate an Android stacktrace using a mapping file?

This article covers some detailed steps about retracing stacktraces which we get from google play store crash reports, firebase crash reports or any crash report analytics tools.
Generally, the stack traces we do get can be of ANR(Application not responding) errors, Android services logs for eg broadcast receivers, Intent services, and many more. Tracing those error logs will become a big pain on the development side.
So we will start with the below steps for retracing it.
- Understand the stack trace error report.
- Read the mapping file
- Run the ( proguardgui) tool to retrace it.
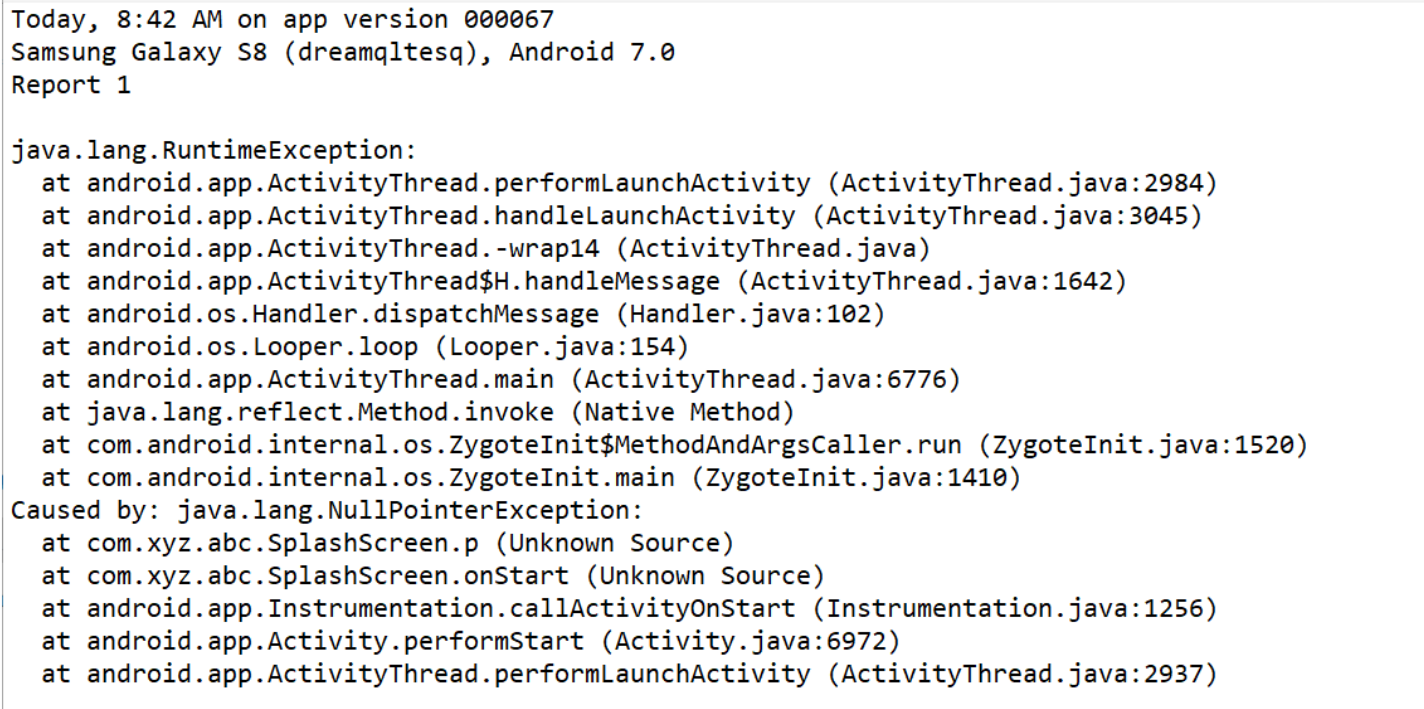
Step 01 : - Read the below stack error report

When you read these logs it becomes difficult to understand and to locate the exact error.
Step 02 :- Read the mapping file
Obtain the mapping file from the below location
< projectname >app/build/outputs/mapping/FLAVOR/release/mapping.txt
Step 03 :- Run the pro-guard tool to retrace it
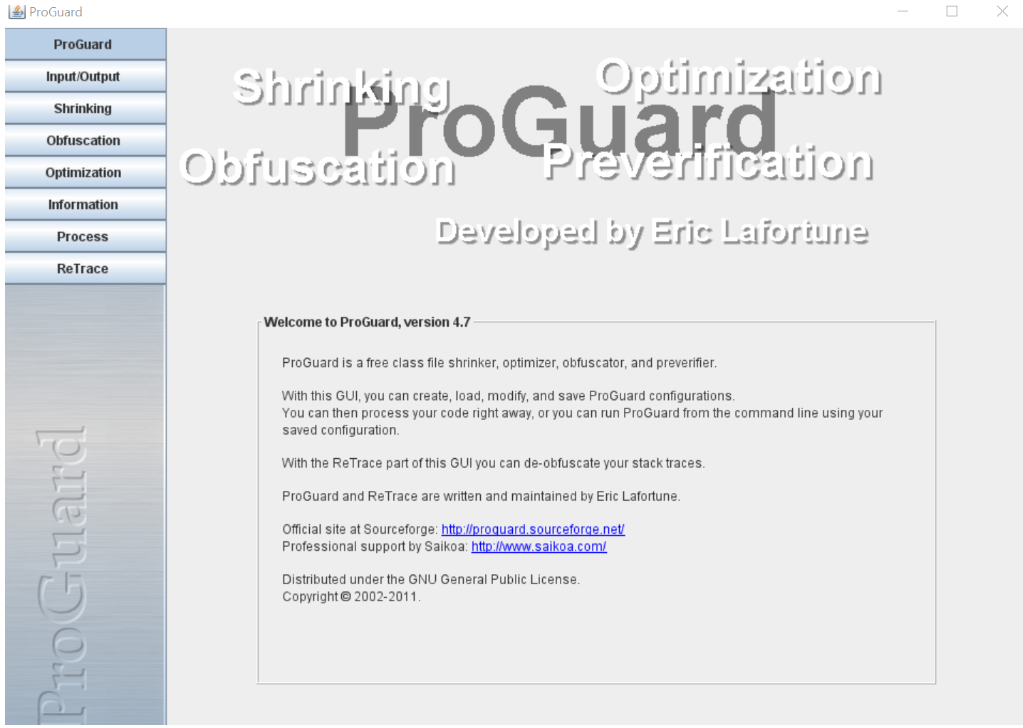
Find the below pro-guard() tool from the below location
< your computer name >/AppData/Local/Android/SDK/tools/proguard/lib

Double click that to get the below window

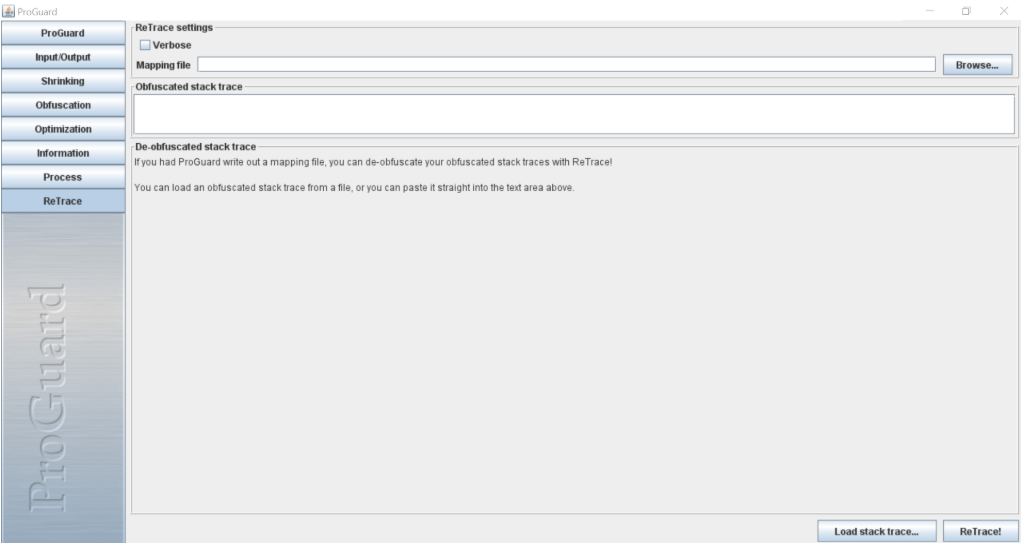
Now click on the retrace option on the left menu side to get the below window.

When you come to this window just browse your mapping.txt file from the above location mentioned in Step 01 and also add your stack trace error logs in the obfuscated stack trace window and finally click on the ReTrace button to get the DeObfuscated error report.
All the above process is doing locally at your development side and this requires some efforts.
There is also another way of doing automatically using Google play store console.
Check this website of Google Play Store Console for detailed steps.
I think we have learned some unique ways to retrace the stack error report.
Thank you for your time to read my blog. You can reach me out at the below social network channels


